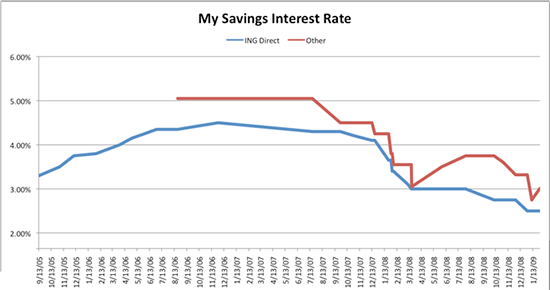
This is a historical graph of the interest rate on my savings account since I opened my ING Direct account on Sept. 13th, 2005 to today. I have since “day-traded” my savings accounts between ING, HSBC, e*Trade, and Capital One. The interest rates vary from a peak of 5.05% to a low of 2.5%. My rate was 3.75% as recently as Nov. 2008. Today I’m earning 3.01% with e*Trade.

A graph of the interest rate of my savings accounts.
| Date | ING Direct | Other |
| 09/13/05 | 3.30% | |
| 11/03/05 | 3.50% | |
| 12/08/05 | 3.75% | |
| 02/01/06 | 3.80% | |
| 03/31/06 | 4.00% | |
| 04/30/06 | 4.15% | |
| 05/31/06 | 4.25% | |
| 06/30/06 | 4.35% | |
| 08/21/06 | 4.35% | 5.05% |
| 11/29/06 | 4.50% | 5.05% |
| 07/19/07 | 4.30% | 5.05% |
| 09/26/07 | 4.30% | 4.50% |
| 11/01/07 | 4.20% | 4.50% |
| 12/13/07 | 4.10% | 4.50% |
| 12/20/07 | 4.10% | 4.25% |
| 01/23/08 | 3.65% | 4.25% |
| 01/29/08 | 3.65% | 3.80% |
| 02/01/08 | 3.40% | 3.80% |
| 02/04/08 | 3.40% | 3.55% |
| 03/11/08 | 3.10% | 3.55% |
| 03/19/08 | 3.00% | 3.55% |
| 03/20/08 | 3.00% | 3.05% |
| 06/02/08 | 3.00% | 3.50% |
| 07/31/08 | 3.00% | 3.75% |
| 10/09/08 | 2.75% | 3.75% |
| 11/01/08 | 2.75% | 3.60% |
| 12/01/08 | 2.75% | 3.32% |
| 12/30/08 | 2.50% | 3.32% |
| 01/10/09 | 2.50% | 2.75% |
| 01/11/09 | 2.50% | 3.01% |
